Where the Milliseconds Go in a Memory Lookup
The stages of a MemorySync query, what latency_ms covers, what 1,320 production queries measured, and the choices on your side that keep a lookup from slowing replies.
Published on 6 min read
On this page
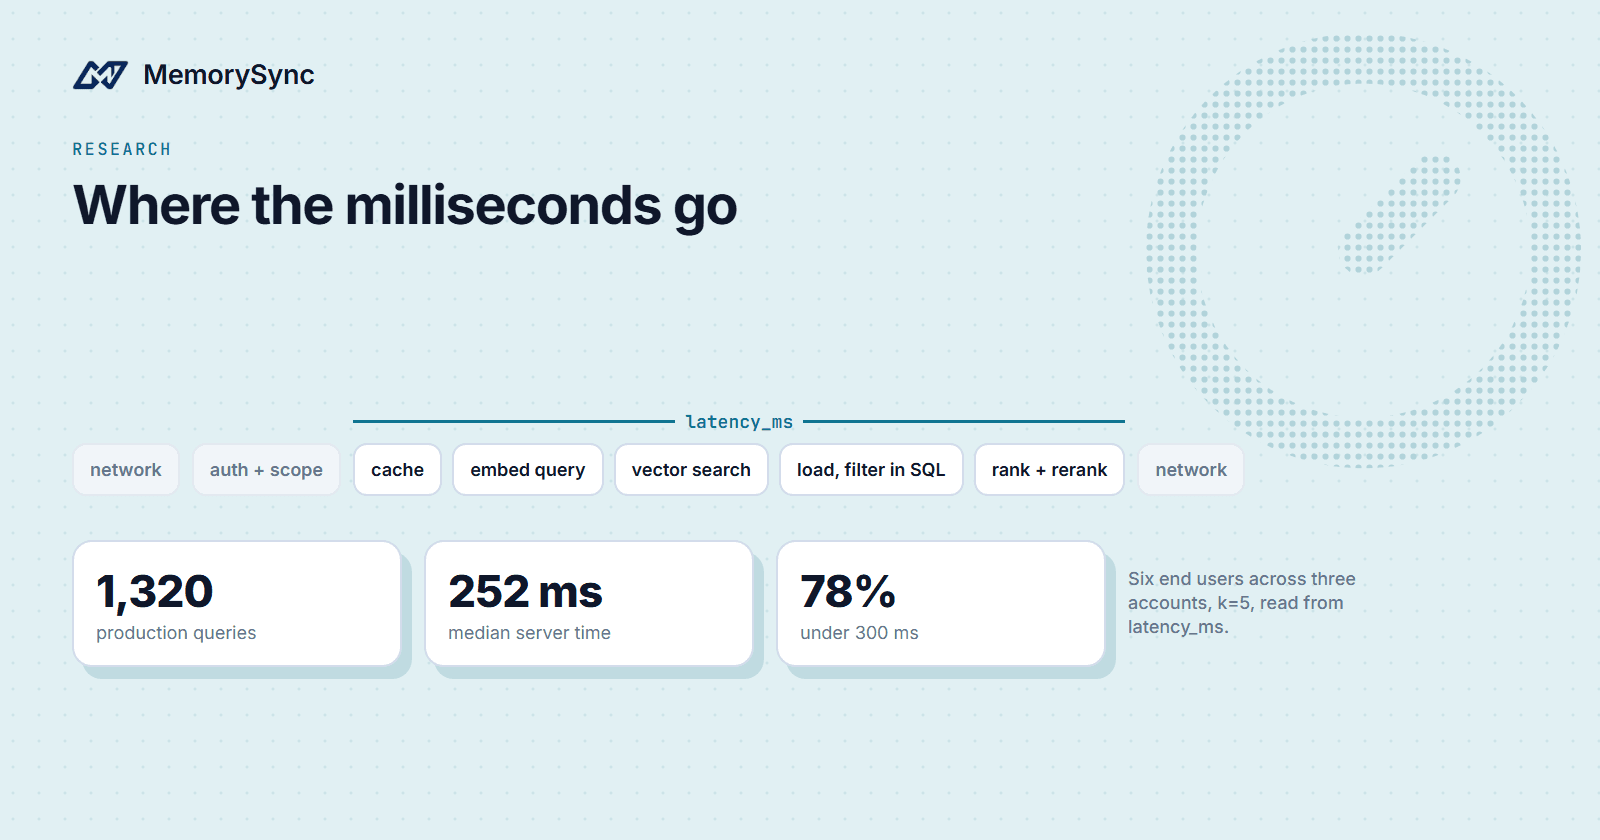
A memory lookup runs between your user's message and the model's first token, so its time is added to every reply that uses it. Server-side retrieval time is typically 70–300 ms, and the network path between your application and our API comes on top of that.
This post walks through the stages of a lookup and what latency_ms covers, reports a production run of 1,320 queries, and lists what you control on your side.
The stages of a lookup
A query to POST /memory/query passes through these stages, simplified:
- Authentication and scope resolution. The API key is checked, and the request is pinned to the key's organization, project and environment, and to the end user named in
X-End-User-ID. - A cache for repeated queries. An identical query from the same end user can be answered from a cache.
- Embedding the query. The question is turned into a vector with OpenAI
text-embedding-3-small. Embeddings of repeated questions are cached, so a repeat skips this call. - Vector search. The stored memories nearest to the question, for that end user, are found.
- Loading candidates. The candidate memories are loaded from the database with the scope filters applied in SQL, so superseded and deleted memories never reach ranking.
- Ranking and a rerank pass. Candidates are scored on semantic similarity combined with recency, importance and how often each memory is used, then reordered by a lexical rerank pass.
- Assembling the response. The ranked memories, the
contextblock and thescoring_breakdownare put together and returned.
The ranking factors are listed here so you know what moves an ordering. Their weights are not published, and integrations should not depend on them.
What latency_ms covers
Every query response includes latency_ms, the server's retrieval time, so you can measure it from your own region. It covers the route's retrieval work. It excludes authentication, the network and response serialisation.
Total time also includes the network path between your application and our API, which depends on where you run. The gap between the time your own code measures and latency_ms is that path plus the steps latency_ms leaves out.
Use different questions when you measure. A repeated question can be answered from the cache, and that tells you nothing about a fresh lookup.
A production run of 1,320 queries
We sent 1,320 queries to the production API and read latency_ms from every response. The run used three separate accounts with two end users each. In every account, one end user held about 20 memories and the other about 65, all written through POST /memory/add from plain statements about work, projects and preferences.
Each end user was then asked 220 different questions through POST /memory/query with k=5. No question was repeated, so none was answered from the cache. The three accounts ran at the same time, each sending one query after another, and all 1,320 queries succeeded.
| Measure | Server time (latency_ms) |
|---|---|
| Median | 252 ms |
| 75th percentile | 291 ms |
| 90th percentile | 340 ms |
| Fastest | 146 ms |
| Finished under 300 ms | 78% (1,036 of 1,320) |
| Finished under 500 ms | 97% (1,281 of 1,320) |
End users holding more memories took longer:
| End users holding | Queries | Median | Under 300 ms |
|---|---|---|---|
| About 20 memories | 660 | 239 ms | 85% |
| About 65 memories | 660 | 267 ms | 72% |
Lookups with less to rank finish faster still. In an earlier check, a query for an end user holding a single memory reported 43 ms, and a query that came back empty reported 73 ms.
Your server time depends on how many memories your end users hold and on what you ask, which is why every response reports it.
What you control
Model generation is usually the largest part of a turn. These choices keep memory a small part of the rest.
Keep one long-lived client
A MemorySyncClient keeps an HTTP connection pool (an httpx.Client in the Python SDK). Create it once and reuse it, and requests travel over connections that are already open instead of paying for a new TCP and TLS setup each time.
The Python SDK sets the end user on the client, so a server that handles many users keeps a client per active user rather than building one for every request. The TypeScript SDK calls your runtime's fetch, so connection reuse there follows the runtime.
Retrieve once per task
Query when a message arrives or a task starts, and pass the result to every step that needs it. A lookup per tool call, or per generated token, multiplies the server time by the number of calls.
Start retrieval alongside other work
If your handler also loads a session, a profile or documents before the model call, start the lookup at the same time instead of after them:
import asynciofrom memorysync import AsyncMemorySyncClient, MemorySyncErrorasync def memories_for(ms: AsyncMemorySyncClient, message: str, budget_s: float) -> list[str]:try:result = await asyncio.wait_for(ms.query(message, k=5), timeout=budget_s)except (MemorySyncError, asyncio.TimeoutError):return [] # answer without memoryreturn [m.text for m in result.memories]async def prepare_turn(ms, message, load_session, budget_s):# The lookup runs while the session loads, not after it.memories, session = await asyncio.gather(memories_for(ms, message, budget_s),load_session(),)return memories, session
Set a budget and answer without memory
asyncio.wait_for puts one deadline on the whole lookup. The Python client's own timeout= is a per-request timeout in seconds that httpx applies to each phase of a request, while the TypeScript client's timeoutMs covers the whole request. Set the budget from what you measure in your region, and when it passes, answer without memory.
Keep k small
k is the number of memories you ask for, and our run used k=5. Ask for what the prompt will use: each extra memory adds to the response and to the prompt your model has to read.
Keep writes off the reply path
add() (POST /memory/add) runs extraction before it returns the stored memory. add_turn (POST /v1/memory/add_turn) returns immediately with status: "processing" and a request_id, and the facts appear shortly after. Either way, schedule the write after the reply, in a background task or a queue, so the user never waits on it.
Measure from your region
This script reads latency_ms from each response and prints the median, next to the median total time your process saw. It prints numbers for your setup only; there is nothing in it to compare with ours.
import osimport statisticsimport timefrom memorysync import MemorySyncClient# Different questions: a repeated question can be answered from the cache.QUESTIONS = ["Where does the user live?","What is the user allergic to?","Which editor theme does the user like?","What does the user do for work?","When does the team ship releases?","What is the user training for?",]with MemorySyncClient(api_key=os.environ["MEMORYSYNC_API_KEY"],base_url="https://api.memorysync.io",end_user_id="sam", # an end user that already holds memories) as ms:ms.query("warm-up question, not counted", k=5) # opens the connectionserver_ms, total_ms = [], []for question in QUESTIONS:start = time.perf_counter()result = ms.query(question, k=5)total_ms.append((time.perf_counter() - start) * 1000)if result.latency_ms is not None:server_ms.append(result.latency_ms)print(f"server time (latency_ms), median: {statistics.median(server_ms):.0f} ms")print(f"total time in this process, median: {statistics.median(total_ms):.0f} ms")
Run it from where your application runs, against an end user that holds a realistic number of memories, with questions like the ones your users ask. The warm-up query opens the connection and is left out, because a long-lived client pays that cost once. The difference between the two medians is your network path plus the steps latency_ms leaves out.
A reproducible comparison
The memory-benchmarks repository is a script you can run yourself. It times a query against an in-process SQLite keyword lookup, an in-process ChromaDB collection that embeds the query on the local CPU, and the MemorySync API, and it reports only what it measured. An earlier version drew its charts from fixed arrays and carried an unmeasured figure; both were removed.
Expect the in-process options to be faster. A SQLite keyword lookup takes microseconds because nothing leaves the process, and if keyword matching inside one process covers what you need, SQLite is the better tool. A hosted lookup crosses the network and does more per query: it embeds the question, ranks by meaning, recency and importance, and filters to one end user.
Next step
Before you go to production, work through the production checklist in the docs. Each item names the evidence that shows it is done.